The researcher tunes each detector, one dataset at a time
Choose a method, train it, find peaks, evaluate predictions and revisit the settings when a different kind of image behaves differently.
Fluorescence images contain small bright signals against an uneven background. Finding their centers means deciding what is a spot, what is noise, and how that decision changes from one dataset to another.
Aggregate improvement rises from -0.0469 to 0.1158.
The largest F1 gain is in telomeres: 0.6796 → 0.8942. The agent combines detector selection, peak tuning and targeted retraining.
Choose a method, train it, find peaks, evaluate predictions and revisit the settings when a different kind of image behaves differently.
The agent changes inference, retrains weak instances and checks the new predictions, carrying each result into the next submission.
The result is a set of spot coordinates, accompanied by per-dataset scores and a record of the changes that produced them.
The task is to find spots across nine microscopy datasets.
Follow the recorded changes from the first detector to the final evaluation.
Rebuilt from recorded changes and scores · Time-compressed animation, not a screen recording
Find fluorescence spots across nine datasets, then use evaluation feedback to refine the detector.
The agent connects model training, spot localization and evaluation, then uses the feedback to choose the next change.
F1 measures the balance between finding reference spots and avoiding false detections; higher is better.
Compare all eight submissions within each dataset, then inspect retained predictions from four datasets at the level of individual spots.
F1 rises from 0.6796 to 0.8942, a gain of 0.2147. This is the largest first-to-final increase among the nine datasets.
DNA-FISH reaches 0.8382 at submission 4 and ends at 0.8358. The per-dataset view preserves these changes, including small declines.
The aggregate improvement rises from -0.0469 to 0.1158. The individual F1 scores show where the gains occur.
First and final F1 for each dataset. Select a dataset to inspect its full evaluation history.
Eight original F1 scores, in submission order. Select a point to see the recorded change.
Original F1 scores · No best-so-far smoothing
Explore the first test image from four datasets. All predictions come from the same separate retained run, outside the eight optimization submissions.
DNA-FISH · img_000.tif · First test image
The supplied comparison figure shows every predicted and reference spot on the same full DNA-FISH image.
The prediction comes from a separate run. Matching and image contrast follow the original figure.
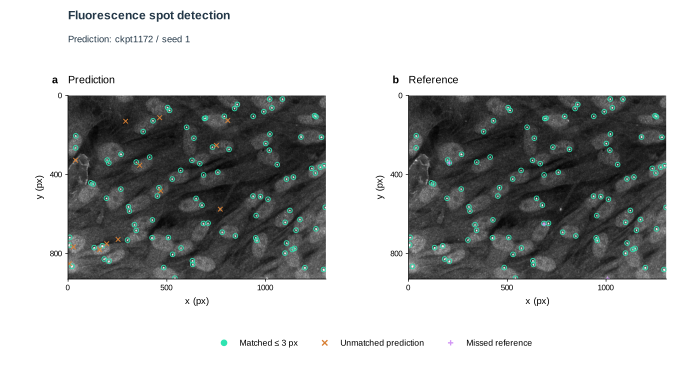
From choosing a detector to checking its output, every submission leaves a record. The optimization scores and the separate image comparison answer different questions: how the method changed, and what each retained prediction detected.